Sunday, April 24, 2011

Pictograph - New York

http://www.eriecanal.org/maps.html
The following map is called a pictograph.  This map combines some of the features of a planimetric map in the way that it can show boundaries but it also depicts what is in those bounded areas with more images.  Normally, these images include certain characteristics that are well known for an area.  For example, this map of New York State shows well known buildings and waterways.

Isotherms - U.S.

http://www.middleschoolscience.com/isotherms.htm
This picture is again an example from the "iso" family that we have come to know and love in cartography.  This map shows isotherms, which are lines of constant temperature. In this picture we can see that that there are pockets of warmer areas across the nation there are dips in temperature like over the Rocky Mountains.

Similarity Matrix - 512 photographs

http://www.fxpal.com/?p=eventDetector
A similarity matrix is very similar to a correlation matrix.  A similarity matrix determines the how close the two data points are.  In the picture above the pixels of 512 photographs was analyzed.  Photographer did this by grouping pictures from similar events into distinct categories and then running a similarity matrix to see how the pixels of the different pictures corresponded.  The blue pixels show a correlation of 0 while the red pixels show a correlation of 1.

Steam and Leaf Plot

http://www.learner.org/courses/learningmath/data/session3/part_d/histogram.html
The steam and leaf plot shown above puts the data in order starting at 520 and ending at 615.  This notation saves space and also works to organize the data somewhat.

Planimetric - Corrective map of the world

http://www.delaus.ec.europa.eu/Youth/map_compare.htm
This map is a planimetric map that has has heads SPINNING.  This is because this gets into the idea of power of maps and critical geography.  Who says that we have to have Europe at the center of a map like it was in Medieval times?  Who also says that we need to have the map oriented towards the North pole?  It has been shown through history that nations wielded power by positioning themselves at the center of a map.  This map finally gives Australia the upper hand!

Parallel Coordinate Map - 9 Selected Genes

http://vis.lbl.gov/Events/SC07/Drosophila/
Parallel coordinate maps are used to show high-dimensional geometry and to analyze data that is multivariate.  The map above shows the parallel coordinate map of 9 selected genes for all cells within the body.

Planimetric- Marauders Map

http://www.newlaunches.com/archives/10_gadgets_we_wish_were_real_instead_of_reel.php
Marauders map is an example of a Planimetric Map.  This map shows only horizontal variations, unlike a topographic map that shows vertical variations as well as horizontal.  Map features in this type of map can show streets, highways, sidewalks, buildings, lakes, rivers; the list goes on and on.  In Harry Potter's world it  showed the various sections of Hogwarts, as well as dots that moved with the movement of certain individuals that Harry was attempting to track!

Choropleth Map - Urban percentage

http://www.neiu.edu/~ejhowens/377/examples.htm
This choropleth map shows the state-by-state percentage of its population that is living within an urban area.  The areas with the lowest percentage include states in the south and also states that are located in the midwest.  States with the highest percentage are areas of the west and of the northeast.  This map is extremely interesting because it makes you think about what influences these percentages.  In the west, this makes sense because many areas are arid and the resources one might need to survive would only be in large urban areas. The northeast is a little trickier.  Maybe this is because these areas have some of the oldest cities in the nation and large populations naturally congregate within them.

DLG - Ottawa, Canada

https://www.lib.uwo.ca/madgic/geospatial/ottawa_data.htm
This map shows a section of Ottawa, Canada transformed into a vector and line form.  This map was more than likely made from either a remotely sensed image or from a land surveying project that was able to accurately gather data.  This information can be put into a GIS and used to maintain databases of relevant information.

Multivariate Map - Australia

http://webhelp.esri.com/arcgiSDEsktop/9.2/index.cfm?TopicName=Drawing_features_to_show_multiple_attributes
Multivariate maps are interesting because they can combine multiple map techniques into one.  For example, the map above is of Australia and depicts the ecoregions and the ecoregion disturbance level.  The ecoregions are depicted through the classed choropleth map and the disturbance level is shown through a proportional circle map.  Through this map we can see that the areas along the coast are the most disturbed and classified as "critical."  This area also coincides with the Montana grassland habitat type.

Flow map - Traffic Flow (Redmond Washington)http://redmondlibrary.blogspot.com/2009/09/redmond-traffic-cameras-and-traffic.html

http://redmondlibrary.blogspot.com/2009/09/redmond-traffic-cameras-and-traffic.html
The map above shows the traffic flow in Redmond, Washington, around 12 pm in the afternoon.  The green indicates areas that are free of congested traffic while the yellows and darker reds indicate areas that are relatively congested with traffic.  Maps like this are becoming more and more common for big cities.  Google maps now has the option to see traffic reports in this color scale form any time during the day.  Looking at this flow of "goods" can save you A LOT of time when you are travelling!

Cartogram - HIV Aids

http://www.spirituality.org.za/2009/08/please-dont-click-this-link.html
The above cartogram shows the HIV AIDs statistics in a slightly different light.  This map bases the depicted area of the countries on how large their percentages are in relation to each other.  Therefore, the countries with the largest percentage of HIV among its people have the largest area, the countries with the smallest percentage are depicted smaller.  From this map we can again see that portions of Africa have the highest rates of HIV in the world.  In relation to these areas with large rates, we can use South America (which is roughly the same size as Africa on a normal map.  South America in this map is SIGNIFICANTLY smaller than Africa, showing that its HIV rates are much smaller as well.

Lorenz Curve - South African household income

http://www.sarpn.org.za/documents/d0000990/
The lorenz curve is often used to show the distribution of income among households.  The percentage of households is printed on the y-axis and the percentage of income obtained is printed on the x-axis.  The blue line that moves diagonally through the graph is called the "line of perfect equality" and represents what the graph would look like if all of the wealth was equally distributed among the population.  The lorenz curve shows the deviation from this equality.  The bigger the area is between the "perfect equality" line and the lorenz curve is, the greater amount of inequality exists.

Correlation Matrix - Tissue to tissue

http://www.livestockgenomics.csiro.au/Genome_to_Phenome/
A correlation matrix is matrix that compares how to values are related to each other.  Correlation can range from values of -1.0 to 1.0, with -1.0 values corresponding to blue and 1.0 values corresponding to red.  When put into a matrix, the chart above becomes apparent.  If you look at the two axes on this chart, the tissues which we are comparing are in the same order.  Therefore, the diagonal line that is going from one corner to the other (the continuous red pixels) occurs because this correlation matrix is comparing one tissue value to the same tissue.  All other lines that appear can also reveal information about the correlation between tissues.

Cartographic Animations - Hurricane Ivan radar loop

http://www.wunderground.com/blog/JeffMasters/comment.html?entrynum=1270&tstamp=&page=18
Cartographic animations are a very important way of displaying results and falls under the realm of geovisualization.  Having a time series of information can inform the viewer of things that aren't necessarily apparent when looking from image to image without the assistance of an animation.  Trends become more apparent as we see images before and after a single frame.  This can even allow us to make predictions and forecasts based off of previous behavior.

The image above is a composite radar loop of Hurricane Ivan as it came onshore in 2004.  This radar loop unveils the structure of the hurricane including the outer bands, inner bands, and eyewall of this Storm.  Because we can see the general movement of the storm, we can make estimations on when certain parts of the storm will arrive within a certain area.

Statistical Map - Adult HIV Prevalence

http://filipspagnoli.wordpress.com/stats-on-human-rights/statistics-on-health/statistics-on-hivaids/
Statistical maps can analyze many different atmospheric parameters and can also run into multiple problems in trying to calculate and display this data.  This is where the Modifiable Areal Unity Problem (MAUP) comes into play.  Whenever we deal with social issues data is usually gathered by the governing body over a region.  There fore, the numbers are only reported over a certain region, which can be ANY size.  Therefore, it is often hard to say everything that needs to be said about the data when dealing with these problems.

In the above map, the prevalence in HIV AIDS in adults was calculated for every country in the world.  This amount was also normalized to the total population within that country and the resulting values were placed along a color scale ranging from green (relatively low) to red (relatively high).  It is obvious that the the countries in Southern Africa have a high rate of HIV among its adults, as does Russia as well.

Hypsometric Map - Goiania Metropolitan Region

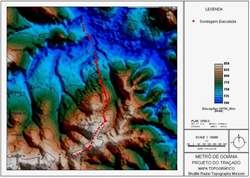
http://www.earthexplorer.com/2009-03/subsurface_geology_challenges_goiania_metro.asp
A hypsometric map is map that shows elevation through a color sequence or through shading around the elevation.  The resolution of the elevation data can contribute to the overall shading effect that the map has.  This is because inbetween two respective contour lines a certain tint or color is given to this area and results in the end product to look as if it were a relief picture.  The picture above is a hypsometric map of the Goiania Metropolitan Region.  The elevation values range from 700-850 meters so the elevation looks slightly exaggerated at first glance to this map.

Isopach - Geopotential Heights

http://www.spc.noaa.gov/publications/thompson/3may99/waf.htm
An isopach map is a map that illustrates the variation in thickness over an area, so isopach lines represent areas with equal heights.  Knowing this height can become useful in multiple fields including meteorology, volcanology, and sedimentology to name a few.  The map above is a map of geopotential heights, and represents the estimated height at which a given pressure should be found based off of surface measurements. For example, if you were to follow a constant geopotential height you would change in actual altitude because the pressure changes continually as you move along the surface of the earth.  In the map above there are overall low geopotential heights in the Northwest U.S. high geopotential heights in the Southeast U.S.

DOQQ - Texas Longhorn Stadium

http://www.tceq.texas.gov/gis/doqtnrcc.html
Digital Orthophoto Quarter-Quadrangle (DOQQ) images are images that have been geometrically corrected so that the distance between two points is the true distance.  This means that the image is corrected for whatever angle that the image was taken (away from the normal, incidence angle).  Maps of this type are often put into a GIS and are used to make vector data files.  The image above is a DOQQ of the Texas longhorn stadium at University of Texas.

PLSS Map - Google Earth

http://freegeographytools.com/2007/plotting-public-land-survey-system-locations-in-google-earth
Public Land Surveying System (PLSS) maps are a way in which the PLSS can divide up and survey land into smaller parcels and include additional information about the land enclosed  This system divides up land into somewhat equal partitions which allows for easier management.  This system helped to facilitate the urbanization of areas by with a square block system for the road design.  The above map was generated in Google Earth and the overlay is the PLSS system in a location in the Western U.S.

Proportional Circle Map - Walmart 2007

http://personal.frostburg.edu/sbriggs0/maps.htm
Proportional circle maps use the relative size of circles to represent different variables.  For example, smaller circle sizes can represent a small magnitude of the variable being analyzed while a larger circle can represent a higher magnitude of the variable.  These circles can also be normalized which can make them easier to compare to each other.

In the map above, the amount of Walmarts in each state are represented with proportional circles.  Our eyes are first drawn to the biggest circle which is in texas, which tells us that the greatest amount of Walmart stores exists in this state.  There is also an overall spatial favoring of Wal-mart stores to exist in the eastern part of the U.S.  If these circles were normalized the differences would be even greater because the states in the West are significantly larger.  The only downside of these maps is that they are not necessarily good for determining small differences.  This is because it is, visually, hard to determine small differences between circles of approximately the same size.

Dot Distribution - FeederWatch participants

http://www.birds.cornell.edu/pfw_fr/Members/ParticipantMap00.htm
Dot distribution maps are an easy way to depict density of whatever variable is being plotted.  The visual clustering of dots shows a high density of the variable occurring while large spacing inbetween the dots shows low density values.  The map above shows the distribution of people that participated in the FeederWatch program for the 2000-2001 migratory season.  Each dot represents someone who was actively watching birds during this time frame and reported all of the data they found to the FeederWatch organization.  From this map it is obvious that there is a much higher amount of people participating in the program in the Northeast portion of the U.S. and Southeast Canada as compared to that of the West and South portions of the U.S.  

Flow Map - American West Flights

http://www.mynetbizz.com/pages/airlines/america-west-airlines/america-west-airlines.cfm
Flow maps are a mixture of maps and flow charts.  The basis for these maps is just a map depicting land and sea (with political boundaries).  On top of this map an overlay of the flow of such things as people or goods.  These maps can be beneficial for a variety of different purposes, since we live in a world that is heavily influenced by the exchange of goods, people, and ideas.

The above image is a flow map for the airline flights that are performed by American West Flights.  We can see that Phoenix and Las Vegas are the major hubs of flights to other various regions of the U.S due to the clustering of flight lines out of the city. This map was also able to show the international flights that American West performs by merging multiple maps into one.

Isoline - Carbon Dioxide concentrations

http://www.jpl.nasa.gov/news/features.cfm?feature=2037
An isoline map is a map joining points that all have the same value of the variable that you are examining.  These values can be wind speed, temperature, elevation, and pressure to name a few.  This mapping technique allows for the analysis of large areas of data as long as the data exists for that area at multiple points.

The map above shows the isolines (the boundary between different colors) of total carbon dioxide concentrations for the entire globe.  This data was obtained from the Orbiting Carbon Observatory.  Knowing this distribution of carbon dioxide over the entire globe can be extremely beneficial for climate models and other atmospheric applications.  

DLG - Lake Tahoe

http://tahoe.usgs.gov/DLG.html
Digital line graphs (DLGs) are a collection of cartographic features depicted through vectors by the USGS.  Storing this data in a digital format allows for easy modifications to take place and decreases the amount of paper maps that need to be used.

The above DLG map of lake Tahoe has many different features.  The red lines represent roads, blue represents both rivers and lakes, and the greens represent vegetation.  Having this digital input of data is extremely important for GIS applications as well.  the vector form of this data allows for in depth data analysis for a variety of different purposes.

DRG - Bushkill, PA

http://www.dpi.nsw.gov.au/agriculture/field/pastures-and-rangelands/establishment/clover/part-f---choosing-the-right-sub-clover-v
Digital Raster Graphics (DRGs) is a digital image created from scanning a USGS paper topographic map.  These maps can be useful as backdrops for overlaying other digital data and also for checking errors within existing vector files of such entities as rivers, lakes, or streams.  These maps are scanned at a resolution of 250 dots per inch so they can be used for this accuracy check with other vector files.

The image above is a magnified section of a DRG for Bushkill, PA.  In it, we can see various features such as constant altitude lines, roads, buildings, and bodies of water.  Having maps such as this (that were created from land surveying practices) is extremely important for digital map accuracy.

Isohyets - Southwest Australia

http://www.dpi.nsw.gov.au/agriculture/field/pastures-and-rangelands/establishment/clover/part-f---choosing-the-right-sub-clover-v
Isohyets are lines that connect areas of equal rainfall amounts.  These values can change over different seasons, years, and even over longer periods.  These rainfall maps can be beneficial to farmers and also with analyzing climate variability.  Specifically, isohyet lines can be used to analyze variation in rainfall amounts between different phases of the ENSO phenomena.

The above image is of Southwestern Australia and and the isohyets are shown in blue.  One notable part of this map is that the rainfall amounts increase as we move toward the coast.  For example, central portions of the region have rainfall amounts of around 250 mm while places along the coast have values well above 1000 mm.

Standardized choropleth map

http://www.directionsmag.com/articles/choropleth-mapping-with-exploratory-data-analysis/123579
Standardized choropleth maps are different from choropleth maps because they normalize this data according to a certain area.  By analyzing data in the form of a percent or per unit area we can compare areas of different size to see how they compare to one another.  For choropleth maps this is a better mapping technique for analyzing data due to the modifiable areal unit problem (MAUP) that exists.

In the map above, the population per square kilometer is depicted for an area broken up into multiple area.  Because this data is standardized, our eyes are quickly drawn to the areas higher population per square mile (the darker colored areas).  Because there are higher population per kilometer values in almost a linear fashion, I would assume that there is some central road or water source that exists close to these areas.

Classed Chloropleth Map - Hispanic/Latino population

http://my.ilstu.edu/~jrcarter/Geo204/Choro/Tom/
Classed chloropleth maps allow for a variable within different areas to be mapped.  This helps us understand the spatial distribution of this variable over larger distances.  The variables that can be measured with this method are limitless, but I believe they are most effective when used with social variables.  With chloropleth maps, the modifiable areal unit problem exists and can sometimes make it hard to see distributions of the variables you are examining.  If the data is spatially resolute enough, the density can be mapped and even greater amounts of meaning can be pulled from the data.

In the above image, a classed cholorpleth map was created for Florida concerning the percentage of hispanic or latino populations within individual counties.  As we can see, as we move into south Florida, the percentage of hispanic or latino citizens increases.  Values as high as approx 57 percent are mapped!

Isopleth - Flu-like Illness (France, 2002)

http://www.femwiki.com/fem/w/fem/choosing-an-appropriate-type-of-map.aspx
Isopleths are lines of that denote constant values of whatever variable you are mapping.  These variables can be anything from wind speed to sickness.  Because isopleths have such a wide range of possible uses, they are utilized in a multitude of different sciences.  This technique of mapping a phenomena can be extremely useful in determining relationships that may exist.

In the map above, incidences of flu-like illness are plotted using isolines in France.  The areas inbetween the lines in this situation are colored in, but they don't have to be.  Through this mapping technique we can see that there is a high concentration of this flu-like illness in the southeastern part of the nation but is relatively low in other areas.

Isotachs - Hurricane Ike

https://www.e-education.psu.edu/meteo241/scatterometry
Isotach lines denote areas of constant wind speed.  Wind speed, which can vary based off of surface pressure and vise versa, can also be used to track storm systems.  But, knowing wind speeds at a high spatial resolution through ground stations is extremely difficult and expensive.  It is because of this problem that wind speeds began to be detected through remote sensing satellites such as QuickSCAT and ASCAT.  Through these satellites we can get a higher spatial resolution but sacrifice accuracy when calculating wind speeds.

In the image above, Hurricane Ike's winds are depicted through using this remotely sensed data.  Isotach lines have been drawn in as well.  Because winds are a function of pressure and the structure of a hurricane creates large pressure gradients in concentric circles from the eye, we can see that the isotachs also exist in concentric circles as well.  As we move closer to the center of the eye, we experience greater wind speeds.

Isobar - May 6, 1999


http://www.maine.gov/dep/air/meteorology/Windrosehome.html
Isobar lines on a map are lines of constant pressure.  Tracking these pressure differences are also an important part of weather forecasting.  Different pressure changes and magnitudes help denote different weather patterns, and hence, aid in the diagnosis and prediction of weather patterns.  The difference between subsequent isobars on a map will vary and depend upon the spatial distribution of surface data points you are able to obtain.

In the map shown above, isobar lines are plotted over the entire U.S.  From this map we are able to see that there are areas that attract immediate attention.  The low pressure system has a tight change (gradient) in the isobar lines and is associated with deteriorating weather conditions.  The high pressure system in the west doesn't have as tight of a gradient around it as the low pressure system and is associated with generally clear weather.  Fronts are depicted with darker lines and either triangles or half circles depending on the type of front that exists.  

Windrose - Maine

http://www.maine.gov/dep/air/meteorology/Windrosehome.html
Windroses are specifically useful to meteorologists because they show the distribution of speed and direction of winds for a specific area.  The concentric circles moving outward from the center denote increasing frequency of winds from that specific direction.

The windrose shown above is for a location within Maine.  From this windrose we can see the the greatest frequency of winds occurs out of the northwest.  Wind directions also seem to favor the West on average than the East and Southeast.

Box plot - Text Anxiety

http://onlamp.com/pub/a/php/2004/07/22/php_anova.html?page=3
Box plots are able to describe a set of data through 5 numerical values: the lowest value recorded, the lower quartile, median, the upper quartile, and the highest value recorded.  These plots help to show us the degree of dispersion within the data and the skewness.

In the box and whisker plots shown above, test scores are reported under varying levels of anxiety.  There are some notable differences that we can see through these plots.  As the anxiety levels moved from low to high, the range of test scores decreased and the overall average test score increased 5-7 points.

Cartogram- California

http://world-geography.org/121-cartogram.html
Geographic cartograms do not depict actual space, but rather bend space to show different attributes.  These cartograms allow us to move past the depiction of physical space and more into social parameters.  The above image shows three different cartograms that exist: non-contiguous, contiguous, and dorling.  Non-contiguous allows the individual areas to be detached from their neighbors while contiguous boundaries are bent to accommodate the different sized areas.  The dorling cartogram uses a uniform, non-overlapping shape that is proportional to the attribute that it is representing. 

The above map is a cartogram (in all 3 types) of California.  In these maps, they are all representing the population in each county of the state in slightly different ways.  In all of the cartograms, we can see that the population in the southern parts of the state greatly outnumbers that of the north.  This can be attributed to the large cities such as Los Angeles that exist.  Getting into a little bit of critical geography, I believe that the map that best represents this population attribute is the non-contiguous cartogram.  This is because it does not distort the shape of the counties and is therefore easier to read and understand.  Both the contiguous and dorling cartograms can render the counties unrecognizable.

Population Profile - Mobile, AL

http://camellia.shc.edu/literacy/tablesversion/assignments/statisticsassign.htm
Population profiles take the population of a certain region and break it up into age groups.  Once these values are obtained, then we can determine the percentage of the population in each group and plot them like in the chart above.  Stacking one group on top of the other in numerical order allows us to compare different age groups and determine different trends in the population as well.

The above population profile of Mobile, AL shows that, relatively, there is a large amount of 0-44 year olds in Mobile.  In fact, the percentages comparing different age brackets as well as a male/female breakdown shows very similar percentages up until the age of 44.  After this point, the population percents dwindles down to the 85+ age bracket occupying only 3-4 percent of the total population.  Another interesting fact is that in the extreme age categories the percentage of females increases relative to the percentage of males.

Propaganda Map - China and Taiwan

http://bektar.tripod.com/maps.html
As was said in an earlier post, maps can be used to wield incredible power, influence opinions, and present ideas.  This map shows how politics can be displayed in a map with simple cartography.  The relationship between China and Taiwan is strained to say the least.  Even though Taiwan (still referred to as the Republic of China) has had Democratic elections, China doesn't recognize it as a separate nation.  It is, instead, regarded as a "renegade province of China".  In this map we can see China depicted as a foot, and the republic of China depicted as a small bug.  The feeling here is that China has incredible power over Taiwan even through Taiwan would like to be considered a separate nation.  I'm not sure if someone in Taiwan would get angry over this map or if they would laugh...

Climograph - Arizona and Australia

http://ag.arizona.edu/watershedsteward//resources/module/Climate/az-climate_pg3.htm
http://www.uwsp.edu/geo/faculty/ritter/geog101/textbook/climate_systems/tropical_steppe.html
Climographs offer a quick and easy way to analyze temperature and rainfall trends over the course of a year.  Within these graphs, the temperature will always be following some sort of sinusoidal curve, but the rainfall can take on different modal characteristics.  

I included two maps for this because I wanted to point out an interesting differences.  The precipitation in the Arizona climograph has a bimodal regime while the precipitation in Australia does not.  Also, if you compare the temperature curves for these two places you will notice that they are 180 degrees out of phase.  This can be attributed to the fact that they are in different hemispheres, and therefore the seasons are different.  Arizona sees its peak in temperature in July while Australia sees its peak in temperature around January.  

Saturday, April 23, 2011

Scatter Plot

http://onlinestatbook.com/chapter4/pearson.html
Scatterplots are useful because they show the relationship between two variables.  The degree to which the plotted points are grouped together gives us insight into the correlation between these variables as well.  A group of points can either be positively correlated, negatively correlated, or uncorrelated.  These different classifications can also have different degrees or correlation as well.

The above scatter plot shows a splay of data points that plot the age of the husband against the age of the wife.  In this scatterplot, there is an obvious, strong, positive correlation between the two ages.

DEM - USA

http://www.math.montana.edu/~nmp/materials/ess/rs/index4.html
A Digital Elevation Model (DEM) is a dataset containing elevation values either in rasterized data form or in a Triangular Irregular Network (TIN).  These datasets are commonly created through remote sensing techniques but can also be made through land surveying.  This data is commonly used in a GIS and is the basis for relief maps.

The above image is a DEM of the contiguous United States.  Through this DEM we can see the commonly known mountain ranges of the U.S.   The rocky mountains are visible in the Western U.S. and the Appalachain mountains are visible along the east coast.

Doppler Radar - Hurricane Katrina

http://www.srh.noaa.gov/tae/?n=climate_2005review
Doppler radar is a key component of weather forecasting.  This method of gathering storm data utilizes pulses of energy in the microwave wavelength and can give us a 3-D view of storm structure through scanning the atmosphere at different elevation angles.  It is through doppler radar that we are able to follow the evolution of severe weather events and warn areas that may be affected.

Above is a doppler radar image of Hurricane Katrina on August 29, 2005.  This image shows composite reflectivity and is a combination of different radar stations data to get a complete image of the storm.  This image is also at the time when Hurricane Katrina was the closest to the city of New Orleans.  We can see that there are higher dBZ values (yellows and reds) around the center of the storm rather than around the periphery.

Black and White Aerial Photo: New Orleans

http://www.maproomblog.com/2005/09/more_new_orleans_satellite_photos.php
Black and white aerial photography is data gathered in the visible spectrum rather than in the infrared.  In this part of the electromagnetic spectrum, black and white color values are exactly what we see in the visible spectrum.  This aerial imagery allows us to analyze large areas of either developed or undeveloped land in a variety of different spatial resolutions.

The image above is a black and white aerial photograph of New Orleans after Hurricane Katrina made landfall on the Mississippi Coast.  Through  this image, we can see what areas of the city are inundated with water.  Because the reflectivities of urbanized areas are high, the areas of the city that are water free look white.  In contrast, the low reflectivity of water makes the areas of the city with water apparent.  In these areas you can see a gridded pattern were the tops of the building are still reflecting radiation but the water in the streets has low reflectivity.  Laissez les bons temps rouler!

Friday, April 22, 2011

Infrared Aerial Photography - Sacramento, CA

http://www.aerialarchives.com/infrared.htm
Infrared sensors and film only detect emitted radiation in the infrared band.  This band can be extremely useful in determining the health of vegetation, marhshes, bays, and oceans.  This is done by examining the varying amounts of radiation from smaller, more specific, bandwiths that are emitted by the environment.

In the above picture, the Sacramento Deep Water Channel is captured aerially (and in infrared).  Through this we can determine the health of the vegetation relatively easy.  The areas that are red are emitting the greatest amount of infrared energy and can therefore be deemed "healthy" vegetation.  If we look at the surrounding areas to the healthy vegetation, there are areas of dark blue and green which correspond to low amounts of emitted infrared radiation.  This means that this area has small (if any) healthy amounts of vegetation.  In this image, the health of the surrounding water isn't as easily determined as the land.

Propaganda Map - Europe 1879

http://daughternumberthree.blogspot.com/2010/01/maps-as-propaganda.html
Maps used for propaganda have immense power.  Small changes in depictions of areas can change the way in which the map-reader perceives that area.  For example, position and size within a map can give an area more relative importance.  A country that is depicted as being bigger and in the center of a map can be perceived as having a considerable amount of power over other areas.  

The map above shows European nations at the end of the 19th century.  This propaganda map is getting its point across not necessarily through position, but through size and cartographic cartoons. In this picture, Russia is depicted as a wolf that is descending upon the other countries (depicted as civilized men).  This map depicts an overall urgency to defend themselves against the Russian nation.  But, within the western European countries that are depicted as men, some countries are depicted as valiant (Germany) while others are either relaxing (Spain) or grasping no weapons at all.  This German made map was more than likely used to emphasize the nation as being heroic, or steadfast.  

Cadastral Map - Prairie County, MT

http://www.prairie.mt.gov/pages/clerk_recorder.htm  (under the BLM map tab)
The above image is an example of a cadastral, or land ownership map.  These maps delineate ownership of land parcels and can sometimes even contain more information about the structures that are contained within these boundaries.  The scale at which a cadastral map is drawn can vary and they bring to and can help resolve ownership disputes.

The above image is a cadastral image of Prairie County, MT, and delineates the area between public land, private land, state land, Bankhead-Jones land, and water.  This map shows that there is a large amount of Bankhead-Jones and Public lands dispersed throughout the county (denoted by the blue and light-blue).  Apart from this, there is a large area of privately owned land in the South-Eastern portion and northern portion of the county (denoted by the white).

Thematic Map - U.S. Sept. 2007 Palmer Drought Index

http://www.wunderground.com/blog/RickyRood/comment.html?entrynum=47
Thematic maps are used to depict a certain theme within a specific geographic area.  This being said, there are  a number of variables that can be mapped such including social, physical, and political indices.  By portraying an area under one theme, the area can be evaluated for regional, relative differences which can help with data analysis.

The above map shows the entire United States classified under a certain value in the Palmer Drought Index in September 2007.  The Palmer Drought index takes into account not only soil moisture budgeting but also the prevailing temperatures within the area as well.  With the same drought index being mapped for the contiguous  U.S., we can see that there is some variability.  Specifically, areas of the Southeast, Mid-Atlantic, and Western states experienced extreme drought conditions as designated by the Palmer Index.  In contrast, the Mid-South and Mid-West regions experienced extremely moist conditions on the same scale.

Topographic Map: Mount Marcy

http://www.adirondacknorthway.net/mappages/mount_marcytopo.php

The above image is a topographic map of Mount Marcy in New York State.  Mount Marcy is the highest point in New York at 5,343 feet high.  It is also a popular destination for hikers and outdoor enthusiasts alike!    We can see that there is a sharp gradient in elevation around Mount Marcy with the closely spaced isoheight lines as well as the relative height numbers that surround the mountain.  The relief shading also performed on the map gives us a three dimensional view of the area as well.  

Topographic maps were historically produced through surveys of the land but topography can now be found through the use of light detection and ranging (LIDAR) remote sensing methods.  These methods can be resolve down to a finer degree of resolution and requires less manual effort than before.  

Mental Map: Steinberg's Manhattan

http://cityhomestead.wordpress.com/2009/02/10/mapping-oakland/

The following is a mental map drawn by Saul Steinberg, a Romanian born cartoonist, for The New Yorker.  In this picture, Steinberg shows an exaggerated mental map of the United States from Manhattan westward to the Pacific Ocean.  This map shows that the perception of space is relatively detailed in terms of the buildings and street names that are depicted close to Manhattan.  But, once we move past the Hudson river we notice that the map becomes EXTREMELY generalized and the entire west is depicted as a rectangle!  As well, the West is seen to have no variation and consists of only a few plateaus and rock formations.  

Mental maps can abstract both space and time.  Often times, we are only able to mentally map the areas that we come into contact with daily.  The repetition of walking past the same places allows us to map out the space in which we live.  For example, as someone who has lived in the south for my entire life,  the Gulf Coast is mapped out in my mind relatively accurately both spatially and characteristically.  But, if I were to even attempt to map the western portion of the U.S., it might as well become a rectangle like that of Steinberg's!  Since I do not have daily contact with this section of the U.S., it doesn't hold importance relative to other areas that I come in contact with constantly.